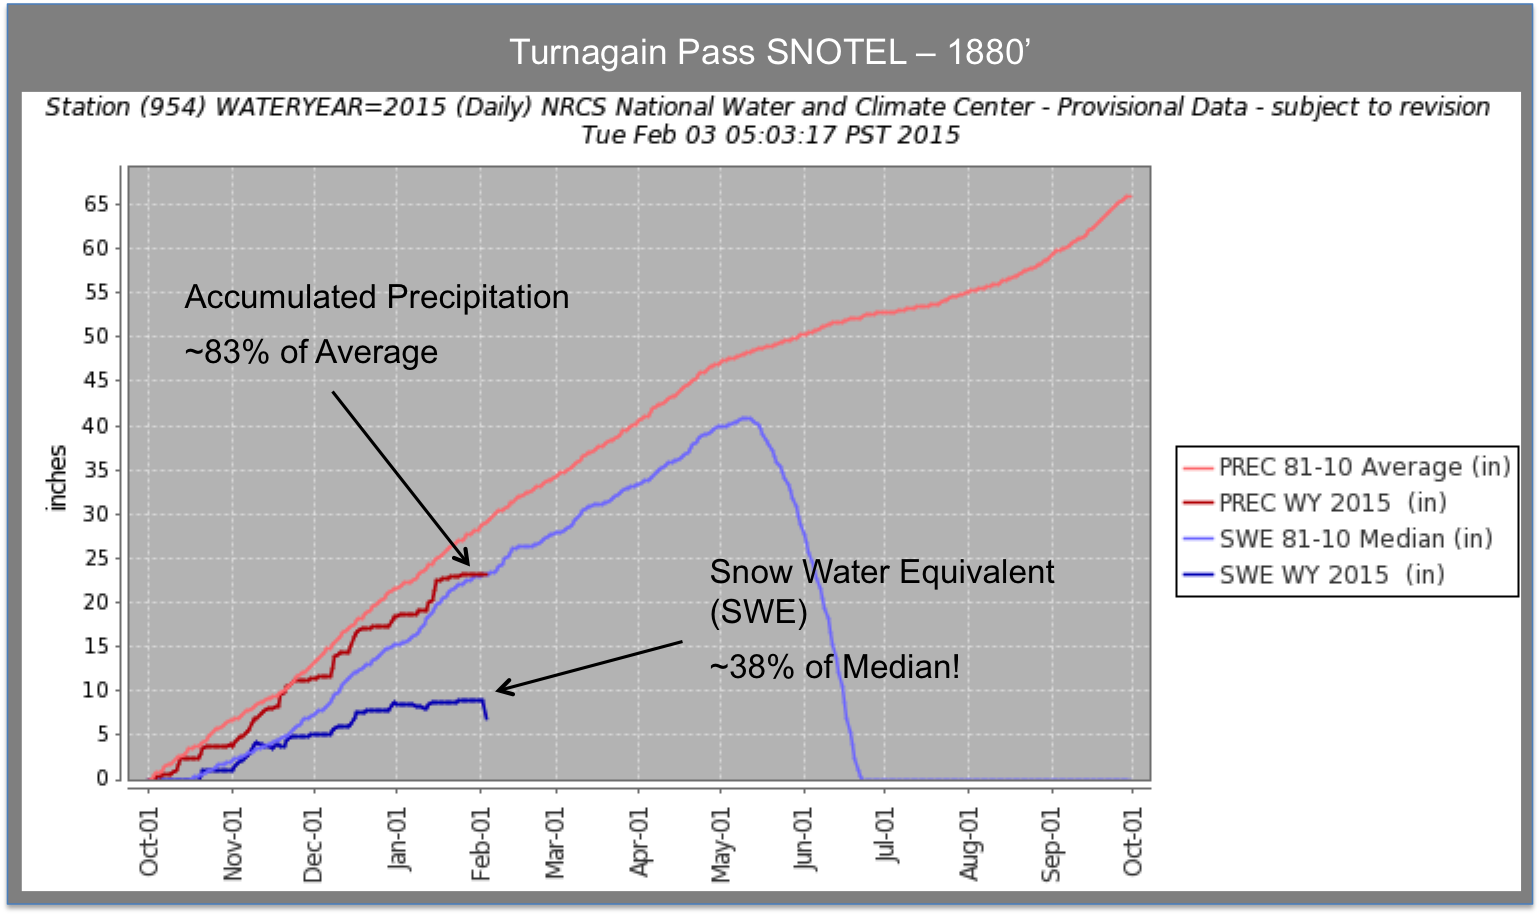
Turnagain Pass SNOTEL data.
Below are a few graphs showing how the snowpack on Turnagain Pass is faring. There are three
parameters measured: 1) accumulated precipitation, 2) snow water equivalent and 3) snow depth. These
graphs show this season to date compared to the long-term averages as well as last season.
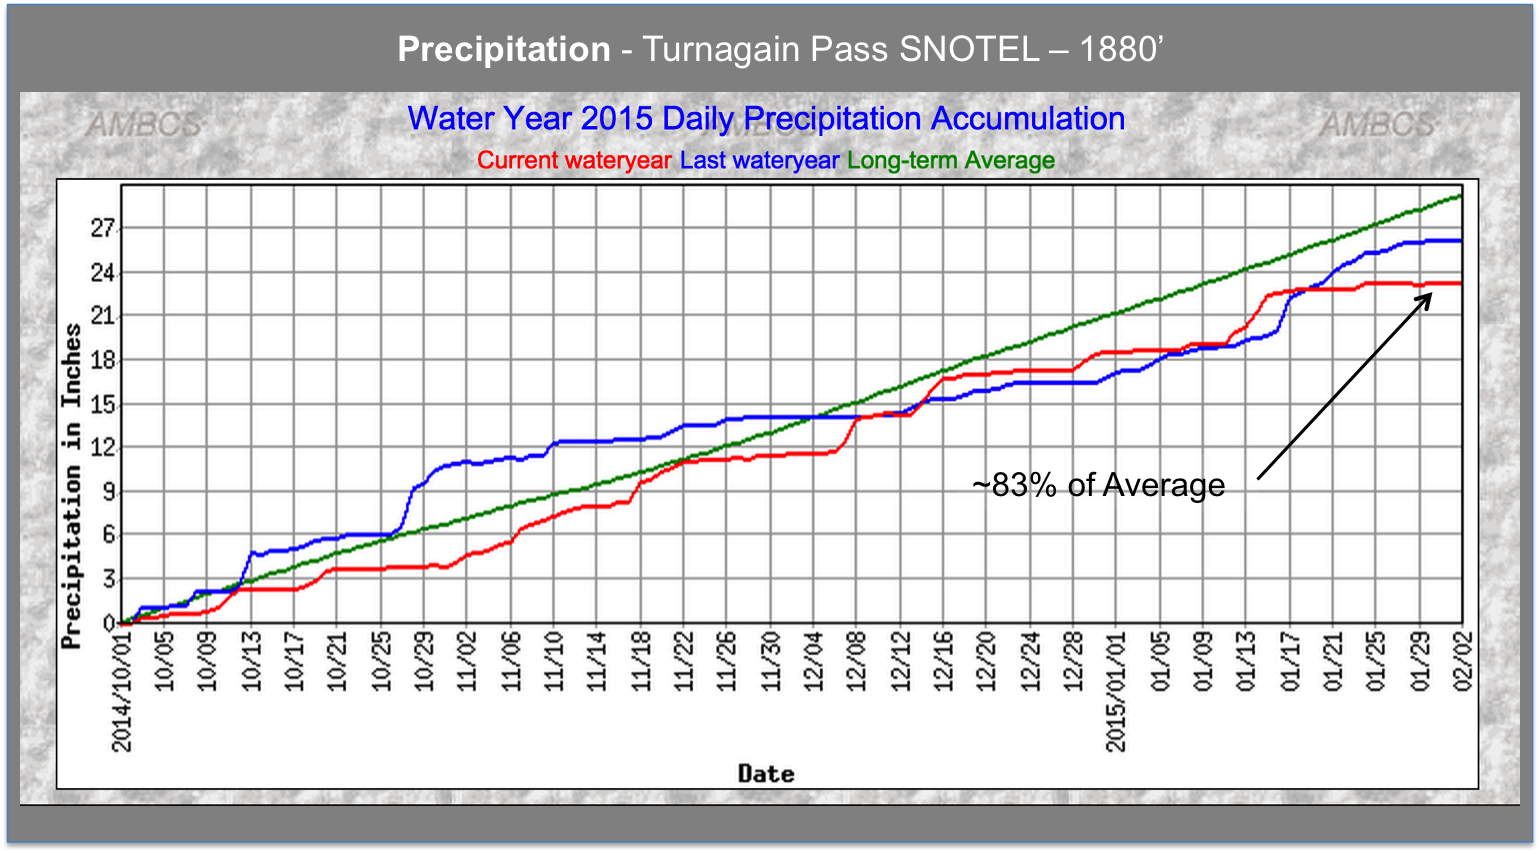
Accumulated Precipitation:
This is simply the amount of rain or snow (water equivalent – if melted) that has fallen.
Surprisingly we are only ~83% of average for this season so far. Clearly, we have had A LOT of rain but not
much snow for this number to be so high.
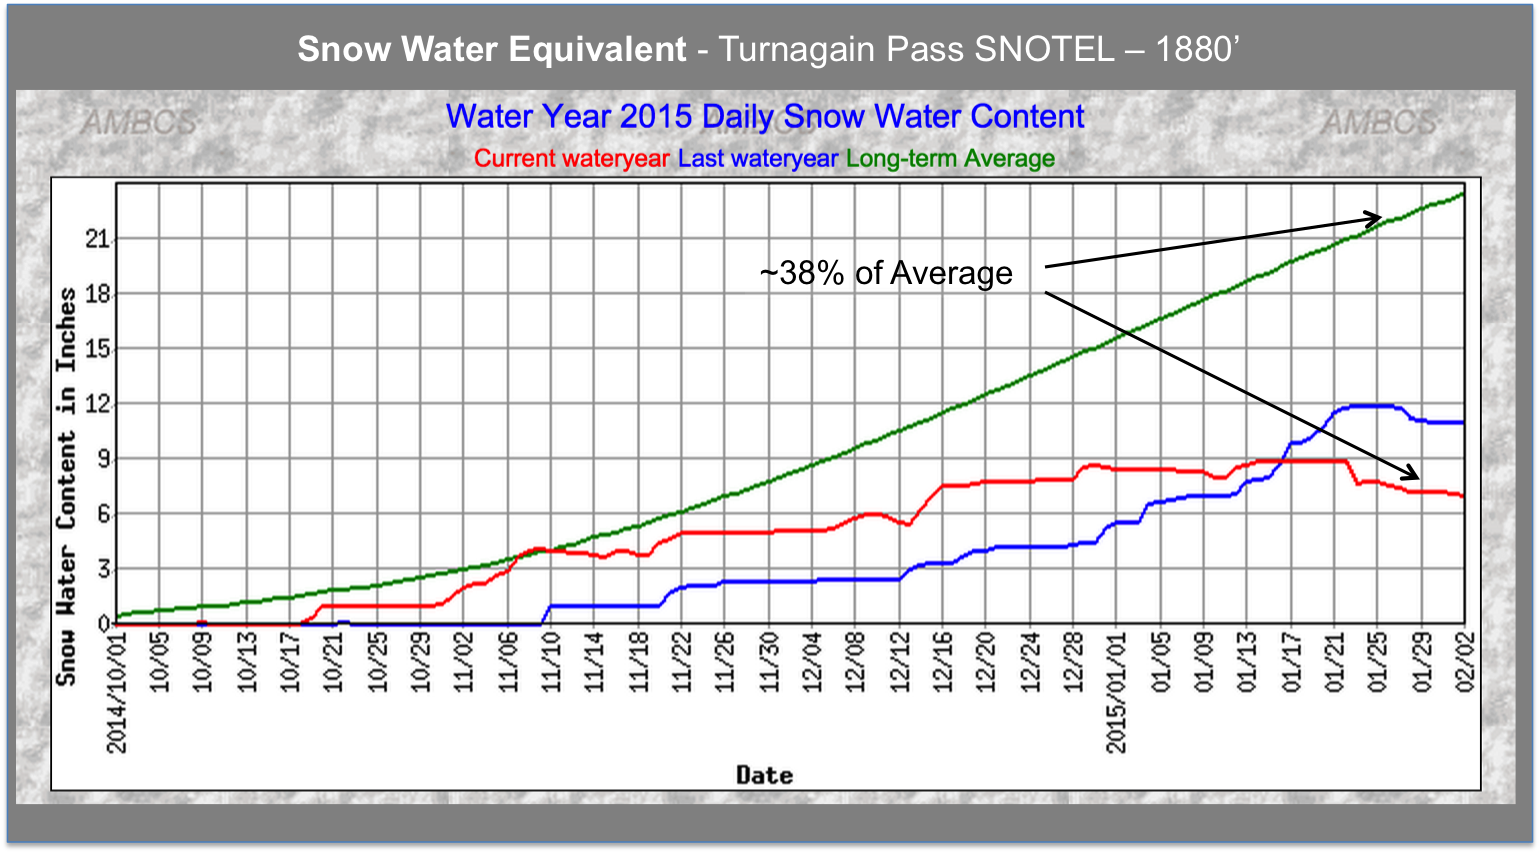
Snow Water Equivalent (SWE), also called Snow Water Content:
This is the amount of water in the snowpack (if one was to melt the snow into water).
We are roughly 1/3 (38%) of normal amounts – this is quite low…
Snow Depth:
This is simply the height of the snowpack.
The snow depth sensor has only been in operation for 11 years now so the averages are not true “long-
term” averages (you need 30 years of data technically for that). However, compared to the last 10 years, we
are 39% of average. Like the SWE above, quite low and not surprising if you’ve been out at the Pass lately.