
Office Chutes - image 1
Office Chutes - image 2
How did we fair for January 2014?
Below are a few graphs showing precipitation, SWE and temperature. All the data comes from the NRCS’s Turnagain Pass SNOTEL site. This is located at 1880′ on Center Ridge.
Precipitation: Thanks to our wet October and January we are 93% of the 30 year average (from 1981-2010).
SWE: Because it was so warm, much of the precipitation during October and January fell in the form of rain and we are at only 47% of the 30 year average for SWE.
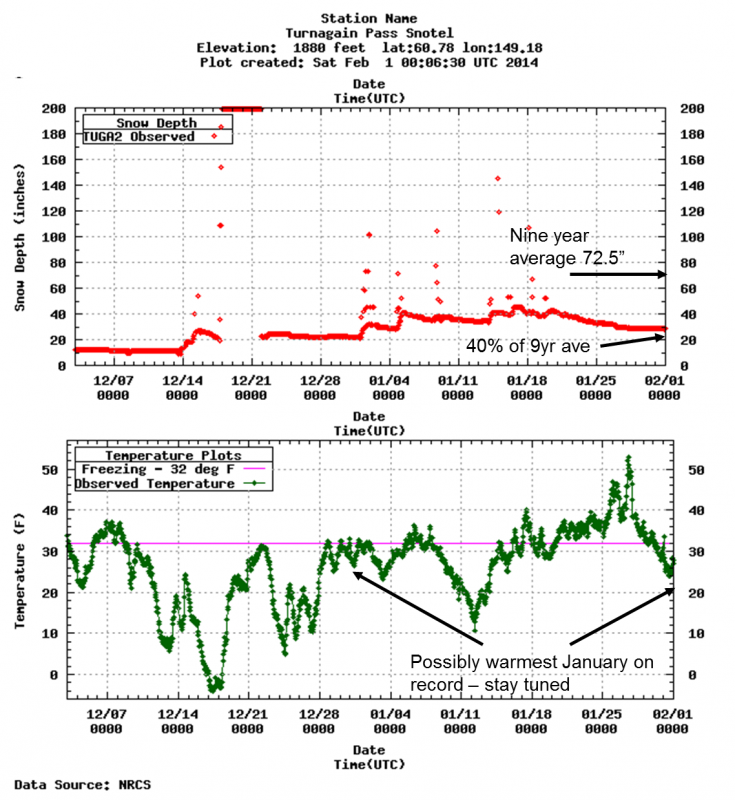
Snow Depth:
There are only nine years of snow depth data from Turnagain Pass to compare with. But, taking the nine year average of 72.5″ for February 1st compared with the 29″ we have on Feb 1st 2014 – we are at 40% for snow depth. (this is a very small sample size)
Temperature: More to come on this. If we didn’t have the warmest January on record we were close.
Office Chutes - image 1
Office Chutes - image 2